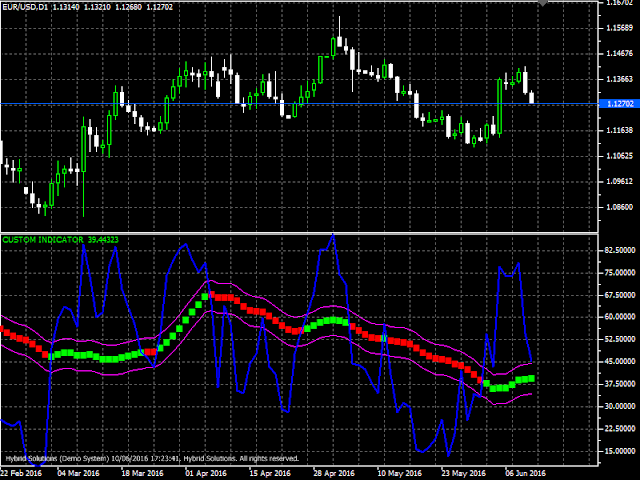
Tarzan is a powerful VertexFX client side indicator that provides precise entry and exit signals based on market cycles.
The concept behind this indicator is to identify market cycles based upon a combination of the two popular indicators Relative Strength Index (RSI) and Simple Moving Average (SMA).
At first step, we calculate the Relative Strength Index (RSI) based on the PRICE FIELD and RSI METHOD. The blue line is a RSI indicator. Then we calculate the Simple Moving Average (SMA) of the Relative Strength Index (RSI).
It is a line of red and green (channel in the form of red and green dots). The indicator is built in a separate window. It consists of the blue line and the channel in the form of red and green dots with the channel.
The boundaries of the channel formed by two lines of pink color.
When the channel color rectangle turns into green and the blue indicator line rises above the upper boundary of the channel then it will be a signal to buy. When the channel color rectangle turn into red and the blue line has fallen below the lower boundary of the channel then it is a signal to sell.
To use Tarzan Indicator download it from here, then place it at VertexFX VTL directory:
C:\ProgramData\VertexFX Client Terminals\"Company name"\VTL10\Local VTL Scripts
Then right click on the tree and select refresh or restart your client station and you will find under VTL local scripts in your client terminal.
You can check this video that talks about Tarzan Indicator:
